
Bounce Rate is Dead: Welcome Engaged Sessions – A Better Way Forward
There are a tremendous amount of negative vibes surrounding GA4. Moreso this month, as Google formally sunsetted Google’s Universal Analytics, an analytics platform many of us came to appreciate.
Amid the growing frustrations regarding GA4’s quirky, sometimes bumbling interface is a rise in questions regarding past metrics. The most notable question surrounds a now elusive Bounce Rate metric.
In Universal Analytics, Bounce Rate was a pillar of nearly every report (often to the chagrin of marketers). The notoriously perplexing metric entangled marketers and clients in confounding, seemingly contradictory exchanges.
“Why is our bounce rate so high?”
“In this scenario, that’s not a bad thing?”
“Then why is it red?”
There are numerous fair and reasonable points of contention regarding GA4’s non-intuitive, often weighty, interface. However, Google’s enhancements of its metrics appears to move in a more sophisticated and intelligent direction. At the heart of this improved modernization is Bounce Rate.
When you open GA4, it’s as if Bounce Rate suddenly doesn’t exist. Once a staple of default reporting views, it now appears non-existent.
But it does exist.
Today, we’ll explain the ways in which both the conceptual concept of Bounce Rate and the actual metric, Bounce Rate, remain.
Did Bounce Rate Go Away? Where Is It?
If you’re one of many marketers who thought Bounce Rate was removed, only to learn that “maybe” it’s still around — don’t feel bad, Google made the situation confusing.
During the early GA4 days, Google seemed to imply it was removing Bounce Rate in lieu of a more modern, “user-engaged” approach to metrics.
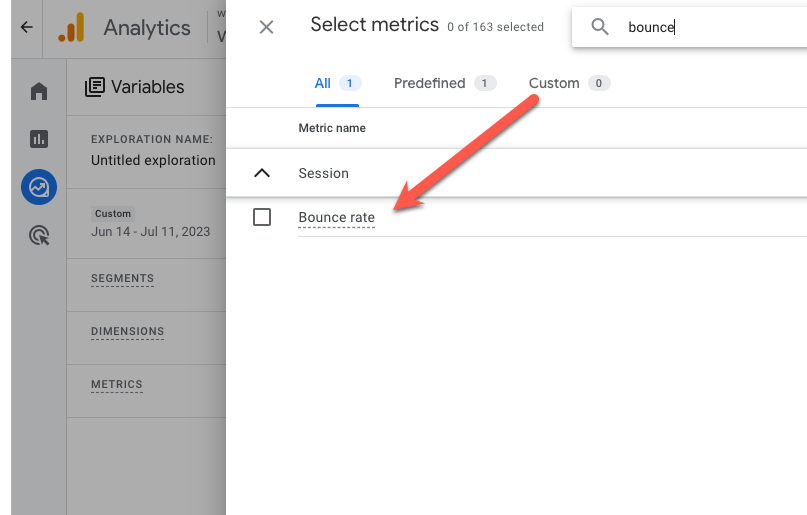
For example, if I go into a Free Form Explorer report and click + under Metrics, I can find Bounce Rate and deploy it in a report.
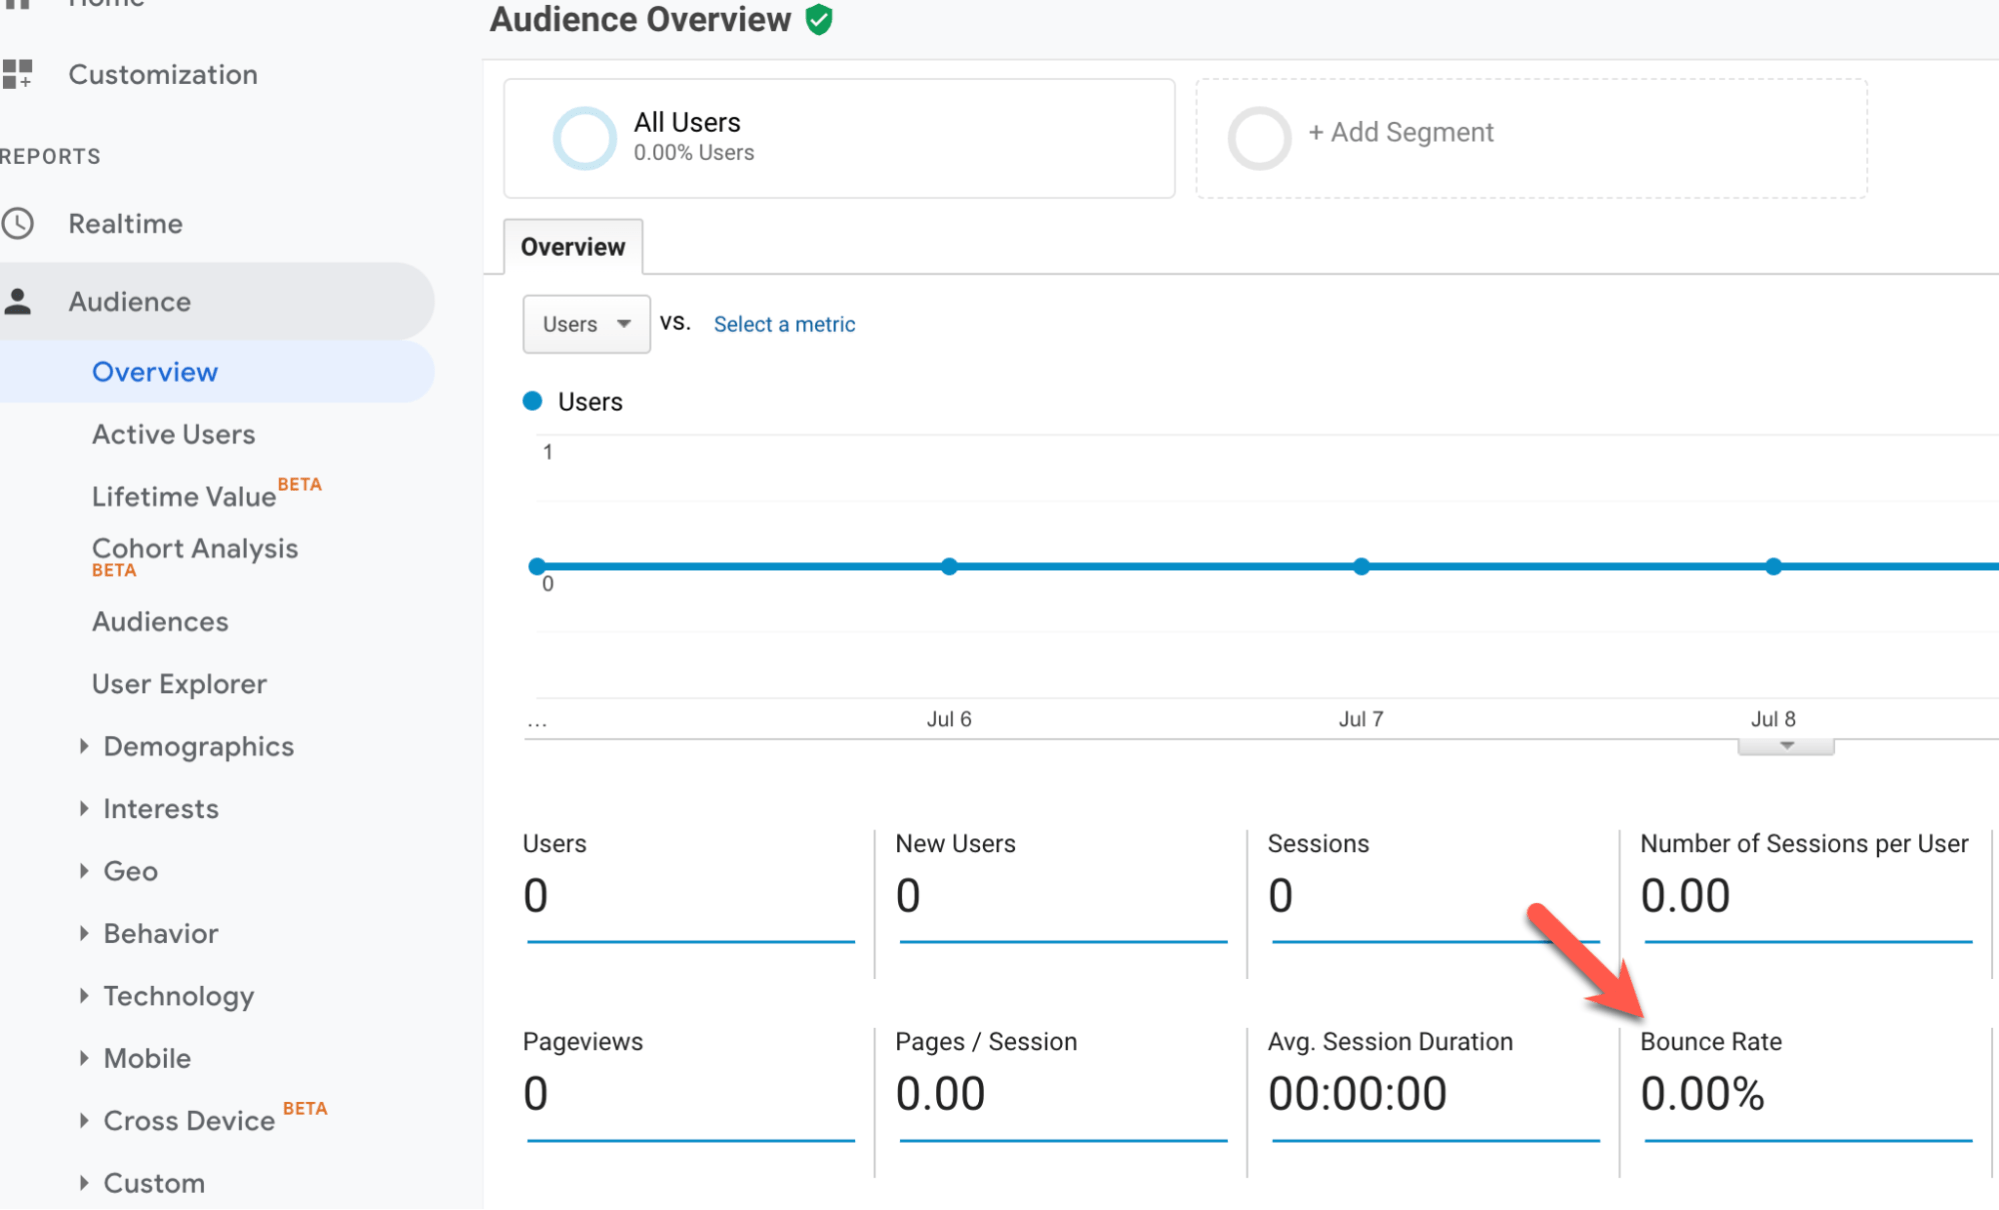
As mentioned earlier, it may feel like Bounce Rate is gone, but that’s due to its lack of deployment in out-of-box reporting. In Universal Analytics, Bounce Rate was a centerpiece metric in out-of-box reporting, such as the default Audience Overview dashboard report.
Google Analytics 4’s New Relationship with Bounce Rate Explained
We mentioned during our opening that marketers and clients often found Bounce Rate confusing. Because clients often view Bounce Rate as “user rejection,” the stat felt like a reflection of that website, or website pages’, viability and status.
In simple terms, most people view Bounce Rate as the result of a dissatisfied user.
Let’s begin by explaining what Bounce Rate is and then move into why Google pulled back exposure to it.
Bounce Rate is the inverse of an engaged session. In the GA4 ecosystem, in order to understand what Bounce Rate means, you’ll need to understand what an engaged session is. Because anything that’s not an engaged session is, in fact, categorized as a bounce.
Fear not, we’re going to explain Engaged Sessions in our next section.
Engaged Sessions, a Better Way to Interpret User Experiences
Bounce Rate did one thing consistently well — it implied a negative scenario.
Clients constantly sought to avoid X percentage on Bounce Rate. When Bounce Rate rose, the red arrow displayed.
Sure, clients desired improvements to their website page’s user experience as a way to “correct” Bounce Rate. But often, and as we’ve shown, there was nothing to “correct.”
Google Analytics 4 shifts us to a more modern way to digest the user experience. The metric is called the “Engaged Session.” Google hopes Engaged Session better encompasses the idea many marketers and clients leveraged Bounce Rate for.
What Is an Engaged Session?
By explaining Engaged Sessions in a simple manner, we equally dismiss the concept of Bounce Rate.
An engaged session in Google Analytics 4 is a session that meets one of the following criteria:
- It lasts for at least 10 seconds.
- It includes one or more conversion events.
- It includes two or more pageviews or screenviews.
So rather than optimizing to avoid a session timing out, we’re optimizing to encourage specific user activity that better signals an engaged mindset. When we read the definition of an Engaged Session, we understand how it resolves the infirm signals that often led to a Bounce.
Evan Fung, Trajectory Data’s Director of Marketing Analytics, offers us an easy-to-understand perspective on the difference between the engaged session and bounce metrics.
“It’s important to understand that the bounce metric, or bounce rate, simply reflects the inverse of the engaged session/rate. We view the move toward engaged sessions as a shift from a ‘negative’ statistic to a more positive and straightforward one. It’s more of a philosophical change that better suits a growth-focused approach to business performance, rather than a risk-averse one.” Fung explained.
Hitching on Evan’s explanation, let’s reframe this for a moment.
Explaining Bounce Rate to clients often felt laborious and, worse, unsure. But as you can see, explaining Engaged Sessions is cut and dry. And with our understanding of engaged sessions, we’re able to qualify our explanations of Bounce Rate in a more impactful way.
Types of Engaged Session Metrics
Engaged Sessions
The number of sessions that met the criteria for an engaged session.
Engaged Sessions Per User
The amount of Engaged Sessions is tallied against the total amount of users. So, if you have 100 users and 200 Engaged Sessions, your Engaged Sessions per user comes to 2. A high engaged sessions per user metric indicates that users are returning to your website or app multiple times and engaging with your content. This is a good sign that your website or app is providing value to users.
Engagement Rate
The percentage of sessions that were considered engaged. Or, Engagement rate = (Number of engaged sessions / Total number of sessions) * 100.
For example, if you have 100 sessions and 20 of those sessions are considered engaged, then your engagement rate would be 20%.
User Engagement
The total amount of time that users spent actively engaged with your site or app.
Average session duration (engaged)
The total duration of all engaged sessions (in seconds) divided by the number of sessions.
Here’s what the calculation looks like: average session duration = total duration of engaged sessions / number of engaged sessions
Conclusion
Engaged Sessions offers a more promising way to reconcile user behavior. Bounce Rate isn’t gone from Google Analytics 4, but it’s unincluded in default overview reporting, giving it much less visibility. In this way, Google is indirectly encouraging the use of Engaged Sessions over Bounce Rate. And that’s a great way forward in the world of analytics.